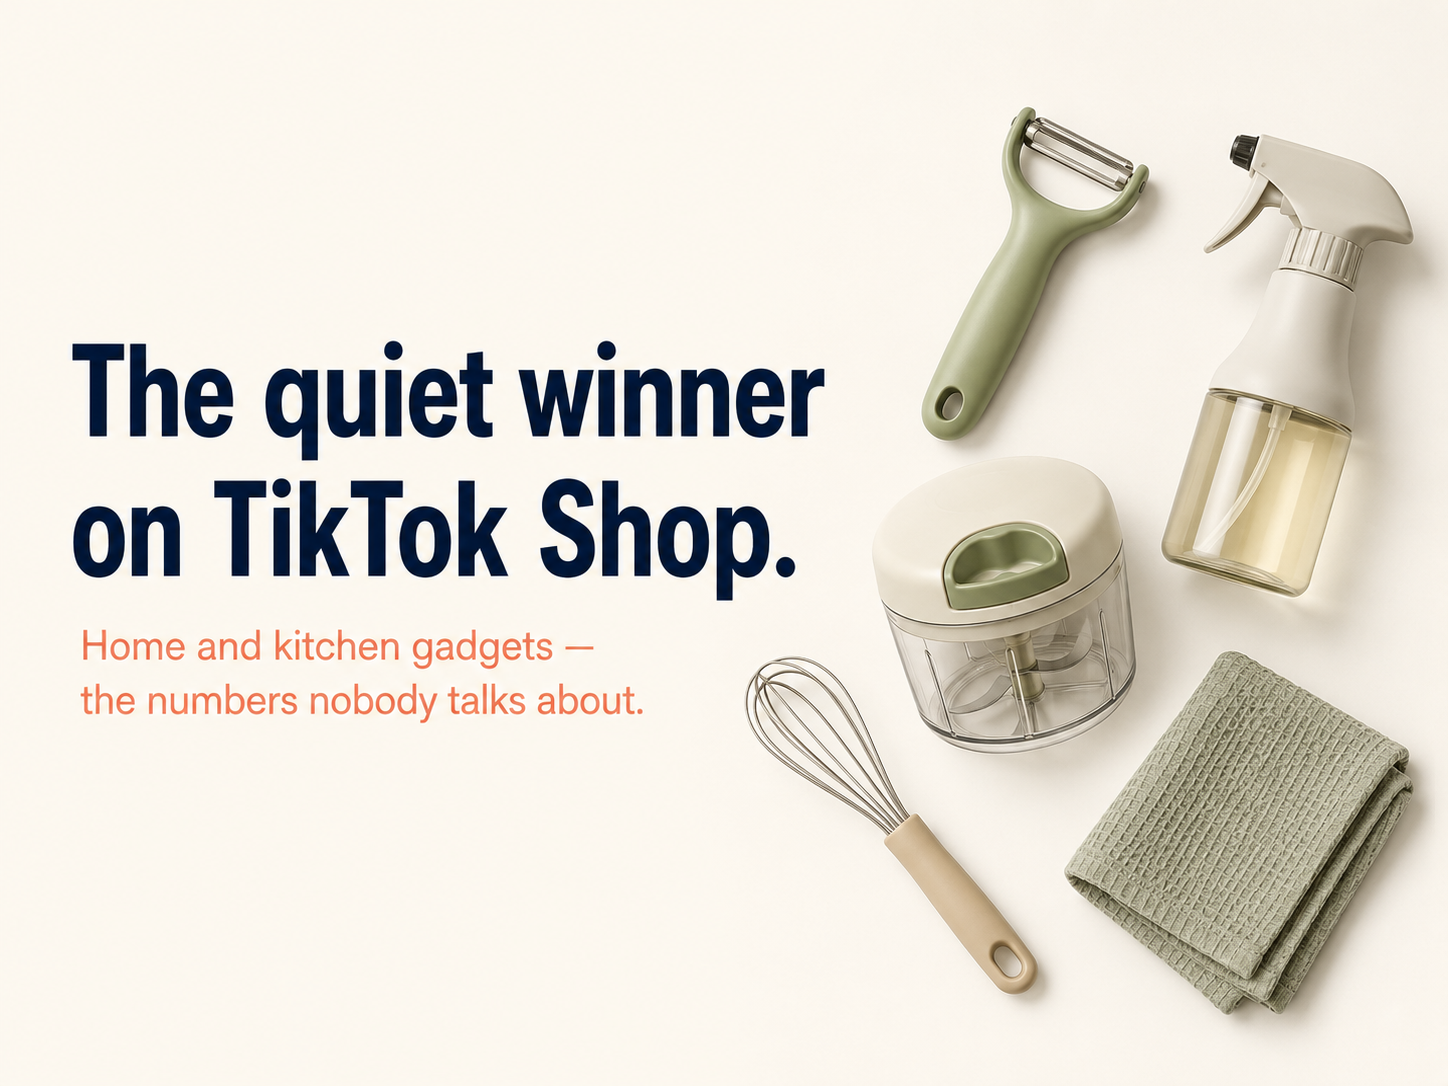
.svg)


Choosing the right TikTok Shop creator is no longer about follower counts or viral videos. As social commerce grows, brands increasingly rely on creators to turn product discovery into actual purchases.
Research suggests that around 78% of TikTok users discover new products through creator or influencer content, highlighting how strongly creator recommendations influence shopping behaviour. At the same time, TikTok Shop itself has expanded rapidly, with global GMV estimated to have reached about US$64.3B in 2025.
Fortunately, the TikTok Shop creator dashboard already provides many of the signals needed to evaluate potential partners. Metrics such as Promotion Performance Score (PPS), GMV distribution, engagement trends, and sales ranges can reveal whether a creator is capable of generating consistent orders rather than occasional viral spikes. When interpreted correctly, these indicators form a practical framework for selecting high-converting creators.
Promotion Performance Score (PPS) is one of the clearest commercial trust indicators available in the TikTok Shop creator dashboard. The score ranges from 0 to 5 and updates regularly based on a creator’s order generation and promotional activity.
Because PPS influences eligibility for campaigns and product collaborations, it functions as a platform-level reliability signal, not just a reflection of content popularity. Creators with stronger PPS scores are typically given broader access to products and campaigns, which reinforces the metric as an indicator of operational credibility.
TikTok positions PPS as a dynamic reflection of how effectively a creator drives sales on the platform. Although the exact formula is not publicly disclosed, order generation and promotional activity clearly influence the score.
In practice, PPS often correlates with several operational indicators:
Creators with PPS ≥3.5 generally gain broader campaign eligibility, while those with PPS ≥4.0 are often considered stronger performers within the creator ecosystem. For example, a creator showing 4.4 out of 5.0 PPS, like the one in your dashboard example, indicates above-threshold commercial reliability.
However, PPS should be treated as a qualification metric rather than a scaling metric. It helps filter creators who are capable of driving sales, but additional metrics are needed to evaluate product fit and conversion potential.
PPS should never be interpreted in isolation. Several patterns may signal potential risk:
For this reason, PPS works best as a reliability gate within a broader creator evaluation framework rather than a standalone performance indicator.
TikTok Shop dashboards display sales data in ranges rather than precise figures. Metrics such as revenue brackets, units sold, and revenue per buyer are presented in buckets, which means they should be interpreted as directional indicators of sales capability, not exact performance.
For brands evaluating creators, these ranges serve as evidence that a creator has already converted viewers into buyers. The key is to focus on signals that indicate consistent transactional activity, rather than isolated results.
In most cases, units sold is a more reliable indicator than revenue.
Revenue can fluctuate depending on product pricing and discounts, while units sold reflects the number of successful transactions. For example, a creator showing 100–1K units sold within a recent period demonstrates real experience converting audience attention into purchases.
When reviewing creators, prioritize those who show:
GMV concentration by category helps reveal whether a creator’s audience aligns with your product.
For example, if 97% of a creator’s GMV comes from a single category, it strongly suggests niche specialization. Creators with this type of focus tend to convert better because their audience already expects product recommendations in that category.
As a practical guideline:
Strong category alignment reduces wasted impressions and improves conversion stability.
Does engagement rate actually predict TikTok Shop sales? Not necessarily. While engagement is often used to evaluate creators, trend stability usually matters more than peak performance. A single viral post can temporarily inflate engagement, whereas consistent interaction across multiple posts is a stronger signal of audience responsiveness.
Industry benchmarks suggest that the average TikTok influencer engagement rate is around 2.18% per post. However, engagement levels vary widely depending on niche, audience size, and content style.
In your dashboard example, engagement fluctuates between roughly 0.6% and 1.8%, stabilizing around 0.8–1.0%. This pattern suggests moderate but testable audience responsiveness, where content hooks and formats likely drive performance differences.
For practical decision-making, engagement can be interpreted using simple operational bands:
When engagement fluctuates significantly, the underlying issue is often creative execution rather than audience quality. In such cases, running A/B tests on hooks, product angles, and storytelling formats can reveal which style resonates best with the audience and drives conversions.
In some creator dashboards, the items-sold trend chart may display a tooltip indicating that the data is unavailable or not authorized. This situation can raise concerns, especially when brands are trying to evaluate a creator’s sales history.
However, missing sales trend data does not automatically indicate poor performance. In many cases, it simply reflects limitations in how data is shared or displayed within the platform. Possible reasons include:
When this occurs, the key issue is reduced visibility rather than negative performance.
From an operational perspective, missing data should trigger additional verification steps before launching a large collaboration. These may include requesting supporting screenshots, asking for recent campaign results, or running a small pilot test to validate performance.
Because real sales data ultimately determines a creator’s effectiveness, validating the creator’s TikTok Shop conversion rate during early pilot collaborations can help reduce uncertainty.
Treat missing observability as a signal that additional validation is required, not as proof that the creator cannot generate sales.
Execution reliability is often overlooked when evaluating creators, yet it directly affects campaign outcomes. Even if a creator has strong sales signals, inconsistent posting or delayed collaboration can reduce the effectiveness of a campaign.
The TikTok Shop dashboard provides several indicators that help assess operational behaviour, including estimated post rate, average commission, product history, and brand collaborations. These metrics offer insight into how consistently a creator completes partnerships.
In your example dashboard, the creator shows:
Together, these signals help reveal how actively the creator participates in affiliate campaigns.
One of the most useful indicators is the estimated post rate, which measures how often a creator actually publishes content after accepting collaborations.
A creator who frequently accepts products but rarely posts can create hidden operational risk. From a campaign management perspective, post rate often matters as much as engagement or sales signals.
As a practical guideline:
• ≥40% → strong execution reliability
• 25–39% → workable with structured follow-ups
• <25% → pilot-only collaboration
Monitoring this metric helps reduce wasted product samples and improves campaign predictability.
Average commission rate primarily affects campaign economics, not creator quality.
For brands launching new affiliate campaigns, offering slightly higher commissions can sometimes encourage early creator participation. However, commission levels should always be evaluated alongside performance signals.
High commission with no evidence of sales experience increases risk, while commission-only pilot collaborations can help test performance without significant upfront cost.
In practice, commission structures should align with the product’s expected revenue per buyer and margin buffer, ensuring that successful campaigns remain profitable as they scale.
Selecting TikTok Shop creators is fundamentally a probability exercise rather than a popularity contest. The creator dashboard already provides many of the signals needed to evaluate potential partners, but these metrics work best when interpreted together. PPS can act as a reliability filter, while category GMV concentration, units sold, and engagement stability help reveal whether a creator is likely to generate consistent sales.
When uncertainty remains, small pilot collaborations are often the most effective way to validate performance before scaling campaigns. For brands that want a more structured approach to creator selection and TikTok Shop growth, contacting eCOMMop can help streamline creator sourcing, campaign management, and performance optimisation.
Most agencies own a slice. The TikTok agency doesn't see your Amazon listing performance. Your Amazon manager doesn't know what's going viral on TikTok. Your Shopify CRO consultant doesn't see either.
We see all of it. Same team, same dashboards, same weekly review. When a TikTok video starts converting at 4×, we know to push that creative into Amazon Sponsored Brands and Shopify paid social — that same week. When Amazon shows a SKU running hot in Texas, we ramp creator seeding for that geo.
That's what "one engine" means in practice. One team. One dataset. One P&L view.